
Best Ball Strategy: Understanding Half Point PPR Scoring
gm, Australia.
As funny as it sounds, I am still a firm believer that one of the greatest advantages in Underdog Fantasy best ball drafts isn’t stacking or correlation. It’s simply understanding that half-point per reception scoring, or 0.5 PPR scoring, is wildly different than full-point, or 1.0 PPR scoring. That little half point per reception changes everything.
Best ball is a draft your team and forget the management of your lineup type fantasy football format. Each week the operating platform (i.e. Underdog) that you’ve drafted on optimizes your starting lineup with the highest scoring players from your drafted roster. This optimization aspect makes best ball unique in that you don’t just want to draft good players, but you want to draft players that also have the ability to contribute points on an every and any week type basis. Therefore, it is incredibly important to understand production for players of all positions to strategically maximize total points scored for your roster.
As 99.69% of all best ball I play is on Underdog Fantasy, the intent of this post is to break down scoring at a macro lens by position, and then to view production at a micro lens by analyzing 2021 player tiered scoring production. Let’s dig into the best ball strategy data.
Macro View
The below data is tiered scoring by position for all 2021 players that had a weekly occurrence of scoring equal to or greater than 10 0.5 PPR points. All %’s are reflective of the sample shown, which again is only occurrences equal to or greater than 10 points. *Source: Fantasypros.com
What is “ceiling” production for each position? I’m defining ceiling as 1st tier (uncommon outliers) and second tier (more frequently seen and obtainable) production
QB - scoring over 30 points can be considered 1st tier ceiling production for the position as there were only 28 occurrences for the position above 30 points. 2nd tier production can be considered between 25 - 30 points; there were 60 occurrences in the 2nd tier, which was produced by 30 players.
RB - scoring over 25 points can be considered 1st tier ceiling production for the position as there were only 42 occurrences for the position above 25 points. 2nd tier production can be considered between 20 - 25 points; there were 74 occurrences in the 2nd tier, which accounted for 17% of all occurrences over 10 points.
WR - scoring over 25 points can be considered 1st tier ceiling production for the position as there were only 47 occurrences for the position above 25 points. 2nd tier production can be considered between 20 - 25 points; there were 70 occurrences in the 2nd tier, which accounted for 12% of all occurrences over 10 points.
TE - scoring over 20 points can be considered 1st tier ceiling production for the position as there were only 22 occurrences for the position above 20 points. 2nd tier production can be considered between 15 - 20 points, there were only 21 occurrences in this tier, which accounted for 23% of all occurrences over 10 points. It could be argued that 1st tier ceiling production for TE is anything over 15 points; TE had a total of 42 occurrences over 15 points, which is a closer total of occurrences to QB (26), RB (42), WR (47) 1st tier.
What is floor production in the sample?
The highest frequency of scoring tier by position is below. It was expected that a macro view of all players that the lowest scoring tier 10 - 15 points should be the most frequently occurred (AKA the floor for the sample). However, that was not the case with QB, which fell under the 15 - 20 Points - 134 occurrences or 30%, barely inching ahead of the 10-15 point tiers 125 occurrences or 28%. Another data point that the QB position is overall consistently higher scoring than the RB, WR and TE positions. All of RB (177 occurrences or 40%), WR (301 occurrences or 51%) and TE (97 occurrences or 63%) fell under the 10-15 point tier most occurring. As expected, tight ends have the most consistent lowest floor of production as 63% of occurrences fall in the 10-15 point tier for the sample.
Other Notes
QB is the highest scoring position as QB had nearly double the occurrences > 30 points (28) compared to RB and WR (16).
RB & WR numbers are overall very consistent for the total occurrences and number of players accounting for those occurrences for the >30 point tier, 25-30 point tier, and 20-25 point tier.
QB had nearly double the occurrences 25-30 points (60) compared to both RB (26) and WR (31). The 60 occurrences were produced from 30 different quarterbacks - there are 32 starting QBs in the NFL!
192 or 42% of QB production occurred at a point > 20 points. RB had 116 occurrences or 27% and WR had 117 occurrences or 20% > 20 points - again for this sample and range of production, the QB positions had double the occurrences compared to RB and WR.
Looking at the total occurrences column (a sum of all occurrences in all tiers), it is worth noting that WR has the most occurrences (592), but again, 301 or 51% occur in the bottom tier. It is very worth noting that the TE position has overall nearly 1/3 or 33% of the total occurrences (154) above 10 points as QB (451), RB (438) and WR (592). This partially makes sense because TE is a ‘onesie’ position in fantasy and there are only so many involved receiving TEs on a team (typically ‘one’ per team). However, when comparing to QB, which is also a ‘onesie’ position, it again highlights how much lower scoring the TE position is compared to all other positions as the QB position has 451 occurrences > 10 points.
Micro View
The below data is tiered scoring for the top 30 0.5 PPR scoring 2021 Quarterbacks. *Source: Fantasypros.com
QB Data Nugz
In reference to the macro 28 occurrences > 30 points, 27 were from the top 30 finishing QBs
In reference to the macro 28 occurrences > 30 points, 23 or 82.1% were from the top 12 finishing QBs
8 quarterbacks of the 11 that scored > 30 points, scored over 30 multiple times: Josh Allen (4), Justin Herbert (4), Tom Brady (2), Patrick Mahomes (4), Dak Prescott (2), Joe Burrow (2), Kyler Murray (3), Lamar Jackson (3)
While the above quarterbacks were elite hitting the 1st tier ceiling, they also produced multiple games below 15 points: Josh Allen (2), Justin Herbert (3), Tom Brady (4), Patrick Mahomes (4), Dak Prescott (5), Joe Burrow (4), Kyler Murray (3), Lamar Jackson (3)
Overall for the 1st and 2nd ceiling tiers, it is easily seen that the majority of scores > 25 points are accounted for by the top 12 finishing QBs; 60 of the 88 or 68% were accounted for by the top 12 finishing QBs. Outliers that had more than one 25 - 30 point finish outside of top 12 finishing: Russell Wilson (3), Matt Ryan (2) and Daniel Jones (2)
24 QBs had multiple games scoring between 20-25 points
Notable player stat(s): Tom Brady (9) had the most games > 25 points, more than Josh Allen (7)
RB Nugz
Only 3 RBs scored > 30 points on multiple occasions: Jonathan Taylor (3), Austin Ekeler (2), Derrick Henry (3) - I have to break format and say it: this is 0.5 PPR ppl - keep being cute and shorting Henry
In reference to the macro 16 occurrences > 30 points, 10 or 62.5% were from the top 12 finishing RBs; nearly 20% less than QB
In reference to the macro 42 occurrences > 25 points, 38 were from the top 36 finishing RBs
As RB 1st tier ceiling production was defined at a lower point (>25) than QB (>30), 10 RBs scored >m25 points more than one time in 2021: Taylor (4), Ekeler (4), Mixon (3), Conner (2), Fournette (2), Kamara (2), Patterson (2), Chubb (2), Henry (3), Penny (2)
Overall for the 1st ceiling tier (>25 points), it is pretty consistent with QB that the majority of production derives from the top 12 finishing RBs. Looking at the 2nd ceiling tier (20 - 25 points), there is a much wider distribution based on finishing position: DeAndre Swift - Darell Williams all RBs finished outside of the top 18 RBs, but finished with multiple 20 - 25 point occurrences. Outliers Darrell Henderson and Sony Michel both finished outside of the top 24, but both scored multiple games between 20-25 points. 15 RBs had multiple games scoring between 20-25 points
Looking at consistency, 15-20 points is the highest scoring tier where it is notable seeing consistent production by the majority of all RBs on the top 36 finisher list
A big difference compared to QB, the overall floor of the RB position per player is significantly lower. 32 of 36 of RBs scored < 10 points at least 4 or more games; 9 of the top 12 finishing RBs had at least 4 games scoring < 10 points. 20 of 36 RBs had 6 or more games < than 10 points
Notable player stat(s): Derrick Henry had 3 games > 30 points in 8 games played - wake up ppl
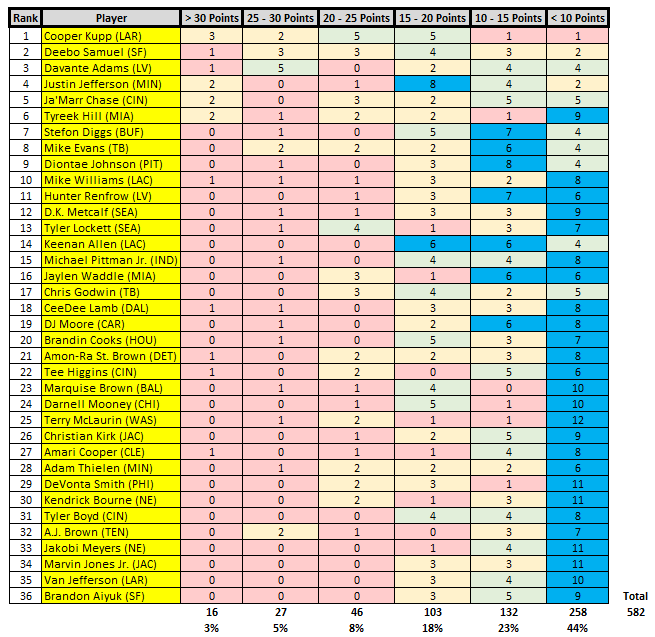
WR Nugz
Only 4 WRs scored > 30 points on multiple occasions: Cooper Kupp (3), Justin Jefferson (2), Ja’Marr Chase (3), Tyreek Hill (2)
In reference to the macro 16 occurrences > 30 points, 12 or 75% were from the top 12 finishing WRs; 7% less than QB and and 12.5% greater than RB
In reference to the macro 47 occurrences > 25 points, 43 were from the top 36 finishing WRs
As we defined WR 1st tier ceiling production at a lower point (>25) than QB (>30), 9 WRs scored more than 25 points more than one time in 2021: Kupp (5), Samuel (4), Adams (6), Jefferson (2), Chase (2), Hill (3), Evans (2), Williams (2), Lamb (2), Brown (2)
Overall for the 1st ceiling tier (>25 points), WR is pretty consistent with RB that 51% of production derives from the top 12 finishing WRs, compared to RBs 57%. Looking at the 2nd tier (20-25) at players outside of the top 18 finishers, most notable is Kendrick Bourne who had two games in this range. Bourne can be bought in RD16 in Underdog drafts
Looking at consistency, 15-20 points is the highest scoring tier where it is notable seeing consistent production by the majority of all WRs on the list
Like RB, the overall floor of the WR position per player is significantly lower than QB. 33 of 36 of WRs scored <10 points at least 4 or more games; 9 of the top 12 finishing WRs had at least 4 games scoring < 10 points. 26 of 36 WRs had 6 or more games scoring < 10 points; 10 more players than RB
Notable player stat(s): Keenan Allen did not have one game over 20 points. Justin Jefferson had 8 games between 15 - 20 points; It could be Jefferson season in a now higher volume passing offense with potential for increased touchdowns in 2022
TE Nugz
Only 3 TEs scored greater than 30 points: Mark Andrews (2), Travis Kelce (1), George Kittle (1)
In reference to the macro 22 occurrences > 20 points, 16 were from the top 12 finishing TEs. For the other 6 occurrences, the only player to have more than one game over 20 points was CJ Uzomah
The 2nd ceiling tier (15-20 points) is the highest scoring tier that any player produced more than two games: Kelce (3), Schultz (3), Gronkowski (5), Knox (4)
Looking at consistency, 10-15 points is the highest scoring tier where it is notable seeing consistent production by the majority of all TEs on the list
The TE position is overall the lowest scoring position
Of the top 36 RBs, 7 RBs had 10 or more games less than 10 points; of the top 36 WRs, 8 WRs had 10 games less than 10 points; of the top 36 TEs, 26 had 10 games or more less than 10 points
Tavis Kelce is the only TE that played greater than 12 games that had less than 6 games under 20 points
Notable player stat: Mark Andrews was 1 of 7 players not named QB to score > 30 points more than one time; AKA Andrews has a ceiling comparative to higher scoring positions, which should be quite notable for the lowest scoring position when the dude is 26 years old.
Concluding Thoughts
QB is the highest scoring position, having nearly double the occurrences (28) over 30 points compared to the next highest scoring positions RB (16) and WR (16). QB also had double the 25-30 point occurrences (60) compared to RB (26) and WR (31). As 82% of first tier (>30) scores were produced by the top 12 finishing QBs, it may stress the importance of drafting an elite QB in Underdog drafts. However, the lower score production (<20 points) that even the elite quarterbacks produce, may justify additional depth at the position as a floor (i.e. 10 point week) could result in a greater loss to competitors at the QB position (i.e. consistent scoring >25 points by the QB position). Easier said, when drafting an elite producing QB, two QB builds are more than viable, but there is greater risk to the downside at the position if the drafted teams QB2 does not peak, when the QB1 troughs. Where as potentially a three QB build may mitigate downside risk because the drafted team has more chances to produce higher scores to cover the tough weeks of the QB1. When missing on an elite QB, additional depth, 3QB builds seems most viable to overall increase the chances to hit primarily second tier (25 - 30) production and consistently hit (20-25) production to reduce points lost to competitors 1st tier scores; a more QBs is more points for the QB position approach.
RB and WR are very similar in overall tiered production. The number of occurrences for first tier production (>25) is nearly identical as RB had 42 occurrences while WR had 47. The top 36 finishing RBs and WRs saw most consistent production between the range of 10 - 20 points, compared to the first (>25) and second tier ceilings (20 - 25) points. Of the top 12 finishing RBs, 7 produced 4 or more games in the 15 - 20 point tier. Of the top 12 finishing WRs, 7 produced 4 or more games in the 10-15 point tier. To be blunt, 15 point scores are more than usable. For both RBs and WRs the draft approach can be similar; when spending high draft prices on either position, there is then less of a need to draft that position throughout the draft. When not spending high prices on either position, there is more of a need to draft more depth throughout the draft. On Underdog, there is overall a greater need to draft more depth at WR as there is one more starting WR position than RB. Final note that there was not overall much of a difference between first (>25 points) or second tier (20-25) ceiling when comparing RBs and WRs at a macro (all occurrences) and micro (top 36 finishers) level.
TE had 22 occurrences greater than 20 points which is less occurrences than the 28 occurrences that QB had over 30 points, and nearly less than the 16 occurrences that both RB and WR had over 30 points. The 10 - 15 point range appears the most obtainable production level for tight ends to consistently produce at as 7 TEs had 4 or more occurrences in that particular range, which was the most for any tier not named <10. This consistency, which is primarily from the top 12 finishing TEs, may be the sole reason to draft depth (three TEs) at TE; as previously noted, 15 point scores even for elite producing WRs is very usable production. Still, TE is the lowest scoring position and the game theory side of me says two tight ends may be a more viable construction when the opportunity cost is additional depth at the other highest scoring positions. Two TEs in my book seems most viable when expending a RD 1 -6 draft price on your first TE.
Additional more specific construction viability posts to come. Thx 4 reading Australia. Get all your ADP data for Underdog at the FantasyUnleashd Podcast.